Unpacking the August 2025 NDSU Agricultural Trade Monitor: IEEPA Tariff Escalation: What it Means for U.S. Food and Ag-Input Imports
- Aug 12, 2025
- 3 min read
Updated: Oct 21, 2025
The August 2025 edition of the NDSU Agricultural Trade Monitor, published by North Dakota State University’s Center for Agricultural Policy and Trade Studies (CAPTS), analyzes the most comprehensive U.S. tariff escalation in decades under the International Emergency Economic Powers Act (IEEPA). The report details how new duties, ranging from a 10% baseline up to 50% for targeted countries, are changing trade flows for agri-food products and agricultural inputs, with exemptions and negotiated arrangements materially shaping the effective burden.
Tariff Increases Redefine the Import Landscape
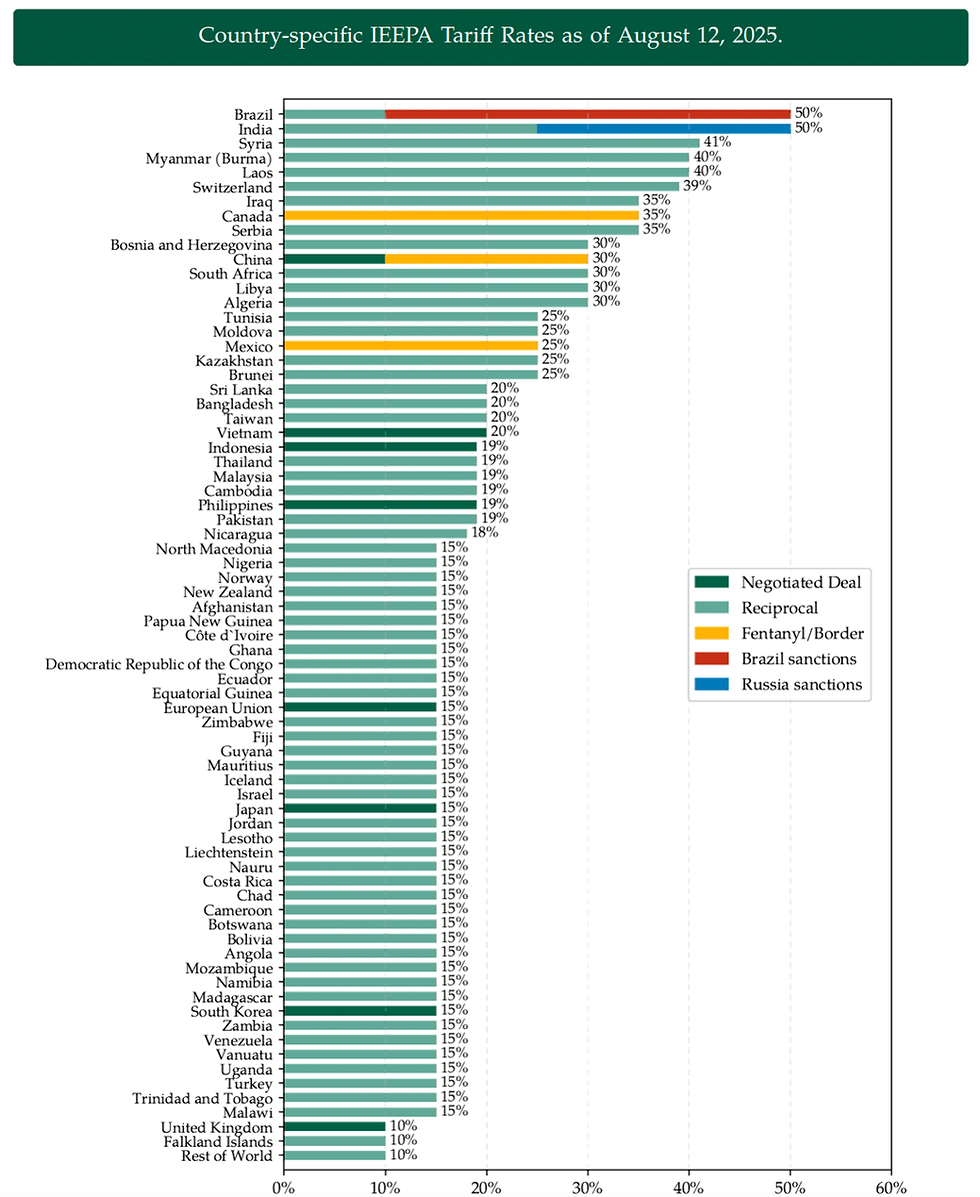
As summarized in Exhibit 1: Summary of 2025 U.S. Tariff Actions and Their Status, the revised reciprocal schedule took effect in early August and introduced differentiated rates across partners (e.g., baseline 10%, Canada 35% on most goods, Brazil and India up to 50%, Switzerland 39%, China 30%), layered on top of existing measures. These actions collectively move average, trade-weighted tariffs higher across a broad set of categories.
Exhibit 1: Summary of 2025 U.S. Tariff Actions and Their Status
The magnitude of the shift is visible in Exhibit 2: Effective Tariff Rates (Trade Weighted) by Agricultural and Food Products, which shows the average effective tariff on U.S. agri-food products rising from roughly 4% under MFN to about 15% under IEEPA once exemptions and sourcing are accounted for. Categories differ widely depending on origin.
Exhibit 2: Effective Tariff Rates (Trade Weighted) by Agricultural and Food Products

Exemptions Shield Key Suppliers
The practical exposure is tempered by carve-outs. As discussed around Exhibit 3: Top 10 Countries Supplying Agricultural and Food Products to U.S. Domestic Consumption, USMCA coverage largely shields Mexico and Canada (the top two suppliers) from additional duties, while arrangements with the European Union prevent tariff stacking (the IEEPA rate is applied net of the MFN in certain cases). This leaves many staples, fresh fruits and vegetables, bakery goods, and dairy at minimal effective tariffs, even as products from Brazil, India, and China face much higher costs. For example, Coffee and beef products from Brazil increased 50%, coffee and bottled water from Switzerland by 39%, and packaged food from China by 30%.
Exhibit 3: Top 10 Countries Supplying Agricultural and Food Products to U.S. Domestic Consumption

Agricultural Inputs Face Higher Costs
The tariff escalation extends deep into the agricultural supply chain, with clear disparities across suppliers and product types. Canada and Mexico, protected under USMCA, continue to provide key fertilizers and machinery duty-free, while specialized pesticides and certain equipment from India, China, Japan, and the European Union now face substantial effective rates.
Overall, the average tariff on imported farm inputs has climbed from roughly 1% under MFN status to about 12% under IEEPA. The steepest increases are in pesticides, with herbicides and other chemical treatments jumping close to 25%. Machinery and equipment also see notable hikes, with tractors and related parts generally in the 13–16% range.
Exhibit 4: Effective Tariff Rates (Trade Weighted) by Agricultural Inputs

Looking at individual products, German and Japanese tractors now face around 15% tariffs, Swiss specialty pesticides approach 39%, while Canadian potash and ammonia remain effectively exempt. These patterns highlight how exemptions and targeted measures combine to shape the true tariff burden across the supply chain, creating higher costs for some inputs while leaving others largely unaffected.
Exhibit 5: Top Countries Supplying U.S. Agricultural Inputs

Mixed U.S. Export Performance
On the export side, the picture is mixed. In June 2025, U.S. agricultural exports were about 3% higher compared to the same month last year, yet overall shipments for the year remain roughly 2% lower. The performance varies significantly by commodity; corn and ethanol have seen solid gains, while soybeans, beef, and poultry have slipped to their lowest levels in five years.
Regional trends reveal an even sharper contrast. Exports to China have plunged by more than 50% so far this year, reflecting both ongoing trade frictions and weaker demand. In contrast, several other markets have posted moderate increases, helping offset some of the losses and underscoring the importance of market diversification to reduce concentration risk.
A More Complex Trade Environment Ahead
Overall, the August 2025 Monitor shows that while nominal tariff increases are historic, the real-world exposure is unevenly determined by exemptions, negotiated deals, and sourcing. For consumers, many staples remain buffered; for importers and producers, cost pressures will be sharpest where exemptions do not apply, especially in differentiated food products and specialized inputs. Ongoing monitoring of tariff schedules, supplier origins, and pass-through dynamics will be essential.
Read the full August 2025 NDSU Agricultural Trade Monitor and download data tables at: https://doi.org/10.22004/ag.econ.364771
Author and Contact Information:
Shawn Arita – shawn.arita@ndsu.edu
Jiyeon Kim – jiyeon.kim@ndsu.edu
Wuit Yi Lwin – wuityi.lwin@ndsu.edu
Sandro Steinbach – sandro.steinbach@ndsu.edu
Xiting Zhuang – xiting.zhuang@ndsu.edu
Ming Wang – ming.wang@ndsu.edu