Tariff Relief: Updated Effective IEEPA Rates on U.S. Food and Agricultural Input Imports
- Dec 3, 2025
- 5 min read
By Jiyeon Kim, Wuit Yi Lwin, and Shawn Arita
In November 2025, the White House announced major reductions in the reciprocal tariff on a broad set of food and ag-input goods. An Executive Order issued on November 14 excluded many agricultural products that make up a large share of U.S. imports. All cocoa products and coffee are now exempt, along with most beef products and some fresh fruit, tree nuts, and fertilizer. Expanding the earlier set of exemptions, a second Executive Order on November 20 removed the additional 40% ad valorem duty on Brazilian nitrogen and phosphate fertilizers and several farm machinery parts.
Alongside these changes, a series of new trade deals through mid-November in 2025 reduced the reciprocal tariffs for major U.S. import partners. China’s rate dropped from 30% to 20% (combined with Fentanyl tariffs), and Switzerland’s fall from 39% to no higher than 15%. Taken together, these changes translate into a significant reduction in import costs across a wide range of food and ag-input goods. A previous CAPTS blog post looked at how country-specific trade deals open new opportunities for U.S. agricultural exports. In this post, we break down the new effective tariff rates, including the latest product-specific exemptions, across food and ag-input products.
Imports of Agricultural & Food Products to U.S. Domestic Consumption
The top exporters of agricultural and food products for U.S. domestic consumption, along with their major export commodities, are shown in Figure 1, based on the three-year average (2022–2024) import value of agricultural and food products. The total IEEPA tariff and the effective IEEPA tariff as of November 20, 2025, are highlighted in red. In this calculation, we account for the removal of the reciprocal tariff on selected commodities and the removal of the 40% tariff on selected products imported from Brazil. On November 14, 2025, the White House announced that the reciprocal tariffs for selected commodities would be exempted. More than 200 agricultural and food product commodities; most of which cannot be produced domestically in the United States, were included in the exemption list These items were previously subject to reciprocal tariffs of 10–30% for most countries as part of the trade-deficit policy, along with additional surcharges on certain countries such as Brazil (+40% on sanctions) and India (+25% on purchases of Russian oil). With this announcement, most reciprocal tariffs on selected agricultural commodities were removed, although other tariff types on specific countries remain in effect.
On November 20, 2025, the White House further announced that the additional 40% ad valorem duty on Brazil would be removed for a set of selected commodities. When the 40% tariff on Brazilian products was first introduced on July 30, five HS8 commodities, including orange juice, citrus fruits, and nuts, were exempted. In the November 20 update, more than 200 additional commodities were added to the exemption list, covering beef and beef products, fresh and processed fruits and vegetables, coffee, tea, nuts, and spices.
Due to the removal of the 40% additional tariff on selected agricultural products from Brazil, the trade-weighted effective IEEPA tariff on Brazilian imports declined to approximately 50% to 30%.
In addition to the IEEPA tariffs, products from Canada and Mexico receive exemptions under the U.S.–Mexico–Canada Agreement (USMCA), and these countries rank first and second among the top ten exporters. Notable differences between total and effective IEEPA tariffs can be seen for countries such as Australia, where only 4.7% of the 10% total tariff is effectively applied, and Colombia, where only 5.8% of the 10% total tariff is ultimately effective. Overall, only about 8.9% of the total 13.5% IEEPA tariff is effectively applied to U.S. imports of agricultural and food products for domestic consumption.
Figure 1: Top Countries Supplying Agricultural & Food Products to U.S. Domestic Consumption and their IEEPA Tariff Rates (As of November 20, 2025)

Note: This map presents total imports of agricultural and food products for U.S. domestic consumption from each country in 2022-2024, the top ten exporters, new IEEPA tariff rates, and the effective IEEPA tariff rates (including exceptions) as of November 20, 2025.
Figure 2 presents the total effective tariff and the changes in the IEEPA tariff between the initial announcement on April 2, 2025, and the updated announcement on November 20, 2025, for each agricultural and food product group. For each group, the most-favored-nation (MFN) tariff and the IEEPA tariff as of November 2025 are also shown. Overall, the effective IEEPA tariff on U.S. imports of agricultural and food products declined by more than 6 percentage points after the November revision compared to August. There are some product groups for which the exemption does not apply; these groups include rice, oilseeds, and industrial alcohol.
Figure 2: Trade-Weighted Effective Tariff Rates by Agricultural & Food Products (As of November 20, 2025)

Note: Status as of November 20, 2025. “Change (November vs. August)” shows the difference between the effective tariff rates in November and those in August.
Ag-Input Imports
Many foreign suppliers of U.S. ag-inputs now see lower IEEPA tariff costs after the recent tariff cuts and the new exemptions for most fertilizer products. UAN, urea, ammonium sulfate, DAP, and MAP are now excluded from the IEEPA tariff, expanding the exemption list announced in April. These newly exempt products represent about 47% of U.S. fertilizer imports in 2024. Combined with the April list, the full exemptions now cover approximately 84% of total fertilizer imports.
As a result, these exemptions lower the overall average tariffs on ag-input imports, and the effect is clear across major import partners. Figure 3 highlights the top 11 countries supplying U.S. agricultural inputs from 2022 to 2024. Below each country name is the average U.S. total agricultural input import value, and the square brackets list the main ag-input commodities sourced from that country. As of November 20, 2025, the baseline and effective IEEPA tariff rates (including new exceptions) are shown in red and in parentheses. The trade-weighted average effective IEEPA tariff falls from 11% to 9% once all changes in November are included. More specifically, the average rates drop from 21% to 5% for Switzerland, 26% to 16% for China, 15% to 10% for Trinidad and Tobago, and a decrease of 1 percentage point for the EU and South Korea. Overall, the average tariff on ag-input imports falls from about 11% to 9% once all the changes are considered.
Figure 3: Top Countries Supplying U.S. Agricultural Inputs and IEEPA Tariff Rates (As of November 20, 2025)

Note: This map presents total U.S. agricultural input imports from each country in 2022-2024, the top two U.S. ag-input import products, new IEEPA tariff rates, and the effective IEEPA tariff rates (including exceptions) as of November 20, 2025.
Breaking down the changes in IEEPA tariffs by agricultural inputs, fertilizer products see some of the biggest reductions. Figure 4 shows the trade-weighted effective tariff rates for ag-input products as of November 20, 2025, using 2024 U.S. import values as weights, and compares effective tariff rates from April and November. Mixed/organic fertilizer, nitrogen, and phosphate see a drop of more than 5 percentage points, driven largely by the new exemptions. U.S. pesticide importers also benefit, with tariff rates dropping by up to 6.4 percentage points. While the fertilizer and pesticides sectors gain from the new trade policy, agricultural machinery sees relatively small tariff cuts. India, a major source of tractors, remains subject to high tariffs under sanctions, and none of the ag-machinery products are excluded from the reciprocal tariffs.
Figure 4: Trade-Weighted Effective Tariff Rates by Agricultural Inputs (As of November 20, 2025)
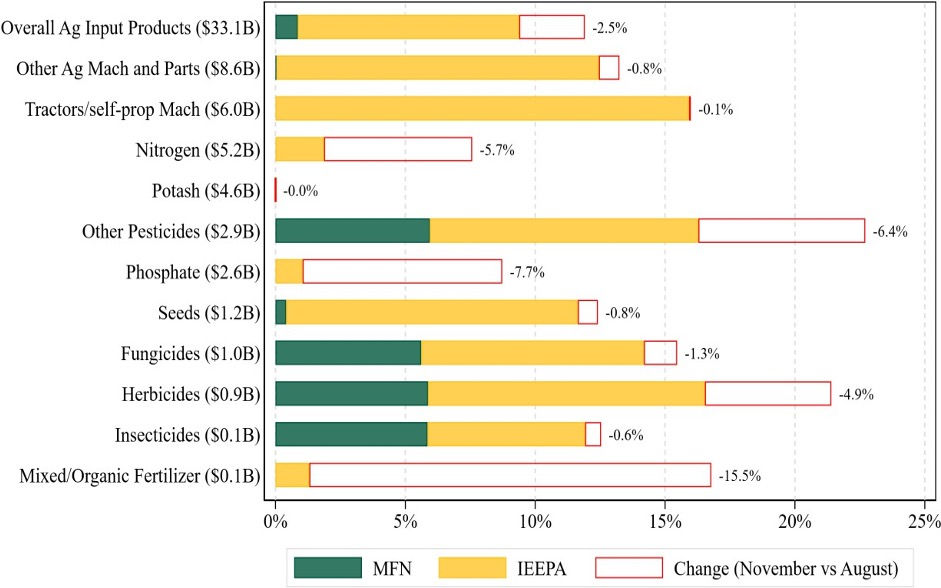
Note: Status as of November 20, 2025. “Change (November vs. August)” shows the difference between the effective tariff rates in November and those in August.
Jiyeon Kim – jiyeon.kim@ndsu.edu
Wuit Yi Lwin – wuityi.lwin@ndsu.edu
Shawn Arita – shawn.arita@ndsu.edu