
Breaking Down the February 2026 NDSU Agricultural Trade Monitor: How IEEPA Tariffs Reshaped U.S. Biofuel Feedstock Trade
- Feb 23
- 4 min read
The February 2026 edition of the NDSU Agricultural Trade Monitor examines how tariffs imposed under the International Emergency Economic Powers Act (IEEPA) reshaped U.S. biofuel feedstock imports during 2025. While the Supreme Court ultimately ruled that IEEPA does not authorize presidential tariff authority, the layered tariff regime implemented throughout 2025 had already altered sourcing patterns, trade flows, and import incentives across used cooking oil (UCO), tallow, ethanol, and biodiesel markets.
A central finding of this report is that the tariffs did not trigger a dramatic collapse in import volumes. Instead, the dominant response was trade diversion, a reallocation of sourcing across countries facing different tariff burdens. Markets adjusted, but they did so by shifting suppliers rather than eliminating demand.
Legal and Policy Context: The End of IEEPA Tariff Authority
On February 20, 2026, the U.S. Supreme Court ruled 6–3 that IEEPA does not authorize the President to impose tariffs. This decision invalidated the tariff authority that had been in effect since early 2025. Later that same day, a temporary 10% global tariff was imposed under Section 122 of the Trade Act of 1974, with a subsequent announcement increasing the rate to 15%.
During 2025, however, the IEEPA-based tariff structure consisted of multiple layers:
A fentanyl-related tariff on China beginning in February 2025,
A 10% baseline tariff on most imports beginning in April 2025,
Country-specific reciprocal rates implemented in August 2025.
These layered measures created differential tariff exposure across trading partners. Countries such as China and Brazil faced significantly higher effective tariff burdens than other suppliers. This uneven structure is essential to understanding the import reallocation patterns observed in UCO and tallow markets.
Used Cooking Oil: Strong Demand, Accelerated Supplier Diversification
Used cooking oil imports provide the clearest evidence of tariff-driven trade diversion.
China, which faced the highest combined tariff exposure, saw its UCO exports to the United States fall 55%, declining from 1.2 million metric tons (January–November 2024) to 540 thousand metric tons over the same period in 2025. China’s share of total U.S. UCO imports dropped from 53% to 27%.
However, this decline did not translate into a proportional contraction in total imports. Instead, non-China IEEPA imports rose 49%, with particularly sharp increases from:• Australia (+400%),• South Korea (+110%),• Malaysia (+36%).
Despite the decline in Chinese shipments, cumulative UCO imports through November 2025 reached approximately 2.0 million metric tons. While modestly below 2.3 million metric tons during the same period in 2024, this level remains well above the 2022–2024 average of 1.3 million metric tons.
This pattern suggests that renewable diesel capacity expansion continued to sustain strong feedstock demand. Tariffs reshaped the supplier mix, but they did not meaningfully suppress overall UCO import dependence.
Exhibit 1: Cumulative U.S. Used Cooking Oil Imports by IEEPA Status, 2025 Compared to 2024.
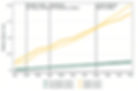
Source: NDSU using trade data from the S&P Global Trade Atlas.
Tallow: Policy-Driven Reallocation After the August Tariff
Tallow imports followed a similar adjustment pattern, particularly after the August 2025 country-specific tariff on Brazil.
Brazil, historically the largest supplier of U.S. tallow imports, faced a 50% tariff beginning in August 2025. Monthly data show a sharp decline in Brazilian shipments immediately following implementation.
This visual clearly demonstrates the discrete policy-driven adjustment.
Unlike other Brazilian agricultural products, Brazilian tallow was not exempted from the additional tariff layers imposed later in the year.
However, total tallow imports did not collapse. Instead, sourcing shifted toward Argentina and other suppliers. Cumulative IEEPA-country tallow imports in 2025 remained above 2024 levels through November. The data also indicate that tallow functioned as a substitute feedstock during periods of tight UCO supply.
Exhibit 2: Monthly U.S. Tallow Imports, 2025 Compared to 2024.

Source: NDSU using trade data from the S&P Global Trade Atlas.
Aggregate Feedstocks: Diversion More Than Destruction
When UCO, tallow, and canola oil are aggregated, the broader adjustment pattern becomes even more evident. Looking at individual commodities can suggest disruption in specific supplier relationships, but aggregation reveals that total feedstock demand remained comparatively stable.
Canola oil imports, largely sourced from Canada, were not directly affected by IEEPA tariffs. As a result, they provided an important stabilizing component within the broader feedstock mix. When combined with UCO and tallow, cumulative feedstock imports from IEEPA-designated countries in 2025 tracked slightly above 2024 levels through October, indicating that overall volumes remained resilient despite policy shocks.
Following the implementation of country-specific tariffs in August 2025, the pace of imports moderated. However, the data do not indicate a dramatic contraction in aggregate feedstock flows. While certain categories, most notably UCO from China, experienced measurable declines, these reductions were partially offset by increased shipments from alternative suppliers and by substitution across feedstocks.
This pattern reinforces one of the report’s core findings: although tariffs altered bilateral trade relationships and reshaped supplier composition, they did not fundamentally suppress total feedstock imports. Instead, the primary margin of adjustment was trade diversion across countries facing different tariff burdens.
Exhibit 3: Cumulative U.S. Feedstock Imports (UCO, Tallow, and Canola Oil) by IEEPA Status, 2025 Compared to 2024.

Source: NDSU using trade data from the S&P Global Trade Atlas.
Finished Biofuels: Tariffs Interacted with Tax Incentives
Finished biofuel imports, ethanol and biodiesel, exhibited more pronounced declines, though tariff effects interacted closely with changes in federal tax policy.
Brazilian ethanol imports fell 37% relative to 2024 levels. Non-IEEPA ethanol imports also declined 24% in the second half of 2025. These declines coincided with the expiration of the $1.00-per-gallon blender’s tax credit on December 31, 2024.
Beginning January 1, 2025, the Section 45Z Clean Fuel Production Credit took effect. Unlike the blender’s credit, 45Z applies only to domestic production, placing imported finished fuels at a structural disadvantage. Biodiesel imports collapsed starting in January 2025, consistent with this policy shift. Thus, in finished fuels, the contraction reflects both tariff exposure and the redesign of federal biofuel incentives.
Additional Policy Headwinds
Beyond IEEPA, new policy developments may further constrain imported feedstocks.
The One Big Beautiful Bill Act extends the 45Z credit but restricts eligibility (after December 31, 2025) to fuels produced from feedstocks originating in the United States, Mexico, or Canada. Additionally, the EPA has proposed assigning only 50% of a Renewable Identification Number (RIN) credit to fuels produced from foreign feedstocks.
Together, these measures suggest that imported biofuel feedstocks may face ongoing structural headwinds, independent of the Supreme Court’s decision on IEEPA authority.
Read the full February 2026 NDSU Agricultural Trade Monitor: https://doi.org/10.22004/ag.econ.393849
For inquiries, contact:
Shawn Arita – shawn.arita@ndsu.edu
Matthew Gammans – matthew.gammans@ndsu.edu
Jiyeon Kim – jiyeon.kim@ndsu.edu
Sandro Steinbach – sandro.steinbach@ndsu.edu
Xiting Zhuang – xiting.zhuang@ndsu.edu