
Breaking Down the May 2026 NDSU Agricultural Trade Monitor: A One-Year Retrospective on China’s Retaliatory Tariffs on U.S. Agricultural Exports
- May 29
- 5 min read
The May 2026 edition of the NDSU Agricultural Trade Monitor offers a comprehensive assessment of how China’s 2025/26 retaliatory tariffs reshaped U.S. agricultural trade over a one-year period. Covering March 2025 through February 2026, the report provides a detailed look at the magnitude of export losses, the commodities most affected, and how trade patterns evolved in response to policy changes.
A $14.9 Billion Trade Shock
At the center of the analysis is the scale of the disruption. Over the one-year window, China’s retaliatory tariffs reduced U.S. agricultural exports by an estimated $14.9 billion on an annualized basis.
This estimate reflects the combined impact of the Fentanyl-related tariffs and the Reciprocal tariff layers introduced beginning in March 2025. Importantly, the estimate is derived using an econometric framework that isolates the effect of tariffs from other factors such as global supply and demand shocks, seasonality, and broader commodity price trends.
This distinction matters. While 2025 also saw developments such as a record U.S. corn crop and global price shifts in key commodities, the model separates those influences from the portion of trade decline directly attributable to tariffs. As a result, the $14.9 billion figure represents a policy-driven shock rather than a general market downturn.
This exhibit shows how tariff rates evolved throughout 2025, including the sharp escalation during the spring and the subsequent reduction following the Geneva agreement and the November Busan framework.
Exhibit 1: China's 2025 Retaliatory Tariff Rates on U.S. Agricultural Imports by Calendar Month.
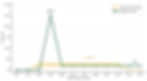
Note: The Reciprocal tariff applies a flat rate to all products, and the Fentanyl tariff applies a 10 to 15 percent rate to a targeted set of agricultural commodities. The shaded band on the Fentanyl line shows the 10 to 15 percent range across targeted commodities.
Source: NDSU using the official Chinese tariff schedule.
Broad-Based Impacts Across Commodities
The impact of tariffs was not limited to a few products but spread broadly across U.S. agricultural exports. The losses are concentrated in key commodities, but nearly all major export categories were affected.
Soybeans account for approximately $6.8 billion, or roughly half of total losses. Beef and cotton each contribute about $1.3 billion, followed by tree nuts at approximately $964 million and corn at $333 million. Additional losses are distributed across coarse grains, pork, poultry, dairy, and a wide range of specialty products.
In total, the five largest commodity groups alone account for over 70% of the estimated export shortfall. This concentration reflects the importance of bulk commodities in U.S.–China trade, while the long tail of smaller categories highlights how deeply the disruption extended across the agricultural sector.
This exhibit ranks commodities by estimated export losses, clearly showing the dominant role of soybeans alongside significant contributions from livestock, grains, and specialty products.
Exhibit 5: Annualized Shortfalls in U.S. Agricultural Shipments to China by Commodity.

Note: The sample is restricted to commodities with a 2024 export baseline to China above $50 million.
Source: NDSU using USDA GATS bilateral trade data.
When the Impact Was Most Severe
The timing of tariff implementation is critical to understanding how the disruption unfolded. Export losses intensified during the active tariff period from March through November 2025, when the Reciprocal tariff rate peaked as high as 125 percent before being partially reduced under the May Geneva agreement.
Following the November 2025 Busan framework, which suspended the highest tariff rates and reduced the Reciprocal tariff to approximately 10 percent, the magnitude of the trade shortfall began to narrow. However, this improvement represents stabilization rather than recovery. Export levels remain well below pre-2025 benchmarks, and contracting cycles for key commodities, particularly soybeans and corn, had already shifted toward alternative suppliers such as Brazil and Argentina before the policy adjustments took effect.
A Larger Shock Than the 2018–2019 Trade Conflict
When placed in historical context, the current episode represents a more severe disruption than the previous U.S.–China trade conflict.
The 2018–2019 retaliation resulted in an estimated $10.6 billion annualized loss, whereas the 2025/26 tariffs generated losses of $14.9 billion, approximately 41% larger.
While both episodes follow similar patterns, rapid declines following tariff implementation and partial recovery after policy adjustments, the current round differs in its timing and persistence. In particular, the absence of a full tariff rollback and the structure of temporary policy suspensions create greater uncertainty for future trade flows.
Geographic Exposure Across U.S. States
Because U.S. agricultural production is geographically concentrated, the impact of export losses varies significantly across states. The report allocates commodity-level losses based on state production shares, revealing a clear regional pattern.
The largest exposure is observed in Iowa, California, and Illinois, each with approximately $1.2 billion in estimated losses. These are followed by Texas, Kansas, Nebraska, Minnesota, Missouri, Indiana, South Dakota, Ohio, Arkansas, and North Dakota.
The Corn Belt and Great Plains dominate due to their concentration in soybeans and grains, while California’s exposure is driven by tree nuts, and Texas reflects a mix of cotton, beef, and grain production. Overall, the top-producing states account for a significant share of the total national exposure.
This exhibit illustrates how export losses are distributed geographically, highlighting the concentration of impacts across major agricultural regions.
Exhibit 8: State-Level Exposure to the Change in U.S. Agricultural Shipments to China in 2025.

Note: Each state's exposure is the sum across commodity groups of the state's 2024 production share multiplied by the estimated 2025 commodity-level shipment shortfall to China. Albers Equal-Area projection of the lower-48 contiguous states.
Source: NDSU using USDA GATS bilateral trade data and USDA NASS state production shares.
China-Specific Losses, Not Total Export Losses
It is important to interpret the $14.9 billion estimate carefully. The figure represents lost exports to China, not total losses across all markets.
In practice, a portion of U.S. agricultural products that were not exported to China in 2025 were redirected to other destinations. U.S. exports to several global markets increased during the same period, partially offsetting the decline in bilateral trade with China.
As a result, the $14.9 billion should be understood as the size of the China-specific trade shock rather than a direct measure of net losses to U.S. producers.
New Trade Commitments and a Path Toward Recovery
Recent policy developments suggest a potential shift in the outlook for U.S.–China agricultural trade. The May 2026 bilateral framework introduced several key measures, including renewed export registrations for U.S. beef plants and resumed access for U.S. poultry from regions free of highly pathogenic avian influenza.
In addition, China committed to purchasing at least $17 billion annually in U.S. agricultural products from 2026 through 2028. This commitment is in addition to existing agreements to import at least 25 million metric tons of U.S. soybeans annually.
Combined, these commitments imply a potential floor of approximately $28 to $30 billion in annual U.S. agricultural exports to China, depending on soybean prices. While these figures represent targets rather than guaranteed outcomes, they signal a possible pathway toward rebuilding bilateral trade flows.
Read the full April 2026 NDSU Agricultural Trade Monitor: https://www.capts-ndsu.com/_files/ugd/3c6228_f69f40fb7983449b877db636a4cd1d6a.pdf
For inquiries, contact:
Shawn Arita – shawn.arita@ndsu.edu
Sandro Steinbach – sandro.steinbach@ndsu.edu
Xiting Zhuang – xiting.zhuang@ndsu.edu